
Life’s Persistent Questions #6: How Big is the Life Insurance Coverage Gap?
By: Eric Sondergeld
9/23/24
The name Life Insurance Awareness Month (LIAM) implies that some may be unaware of the benefits of life insurance and why or whether they may actually need it (or need more of it). There is certainly plenty of evidence that many Americans are un- or under-insured. This begs many questions. How many people are we talking about? How much do they need? Who needs it the most?
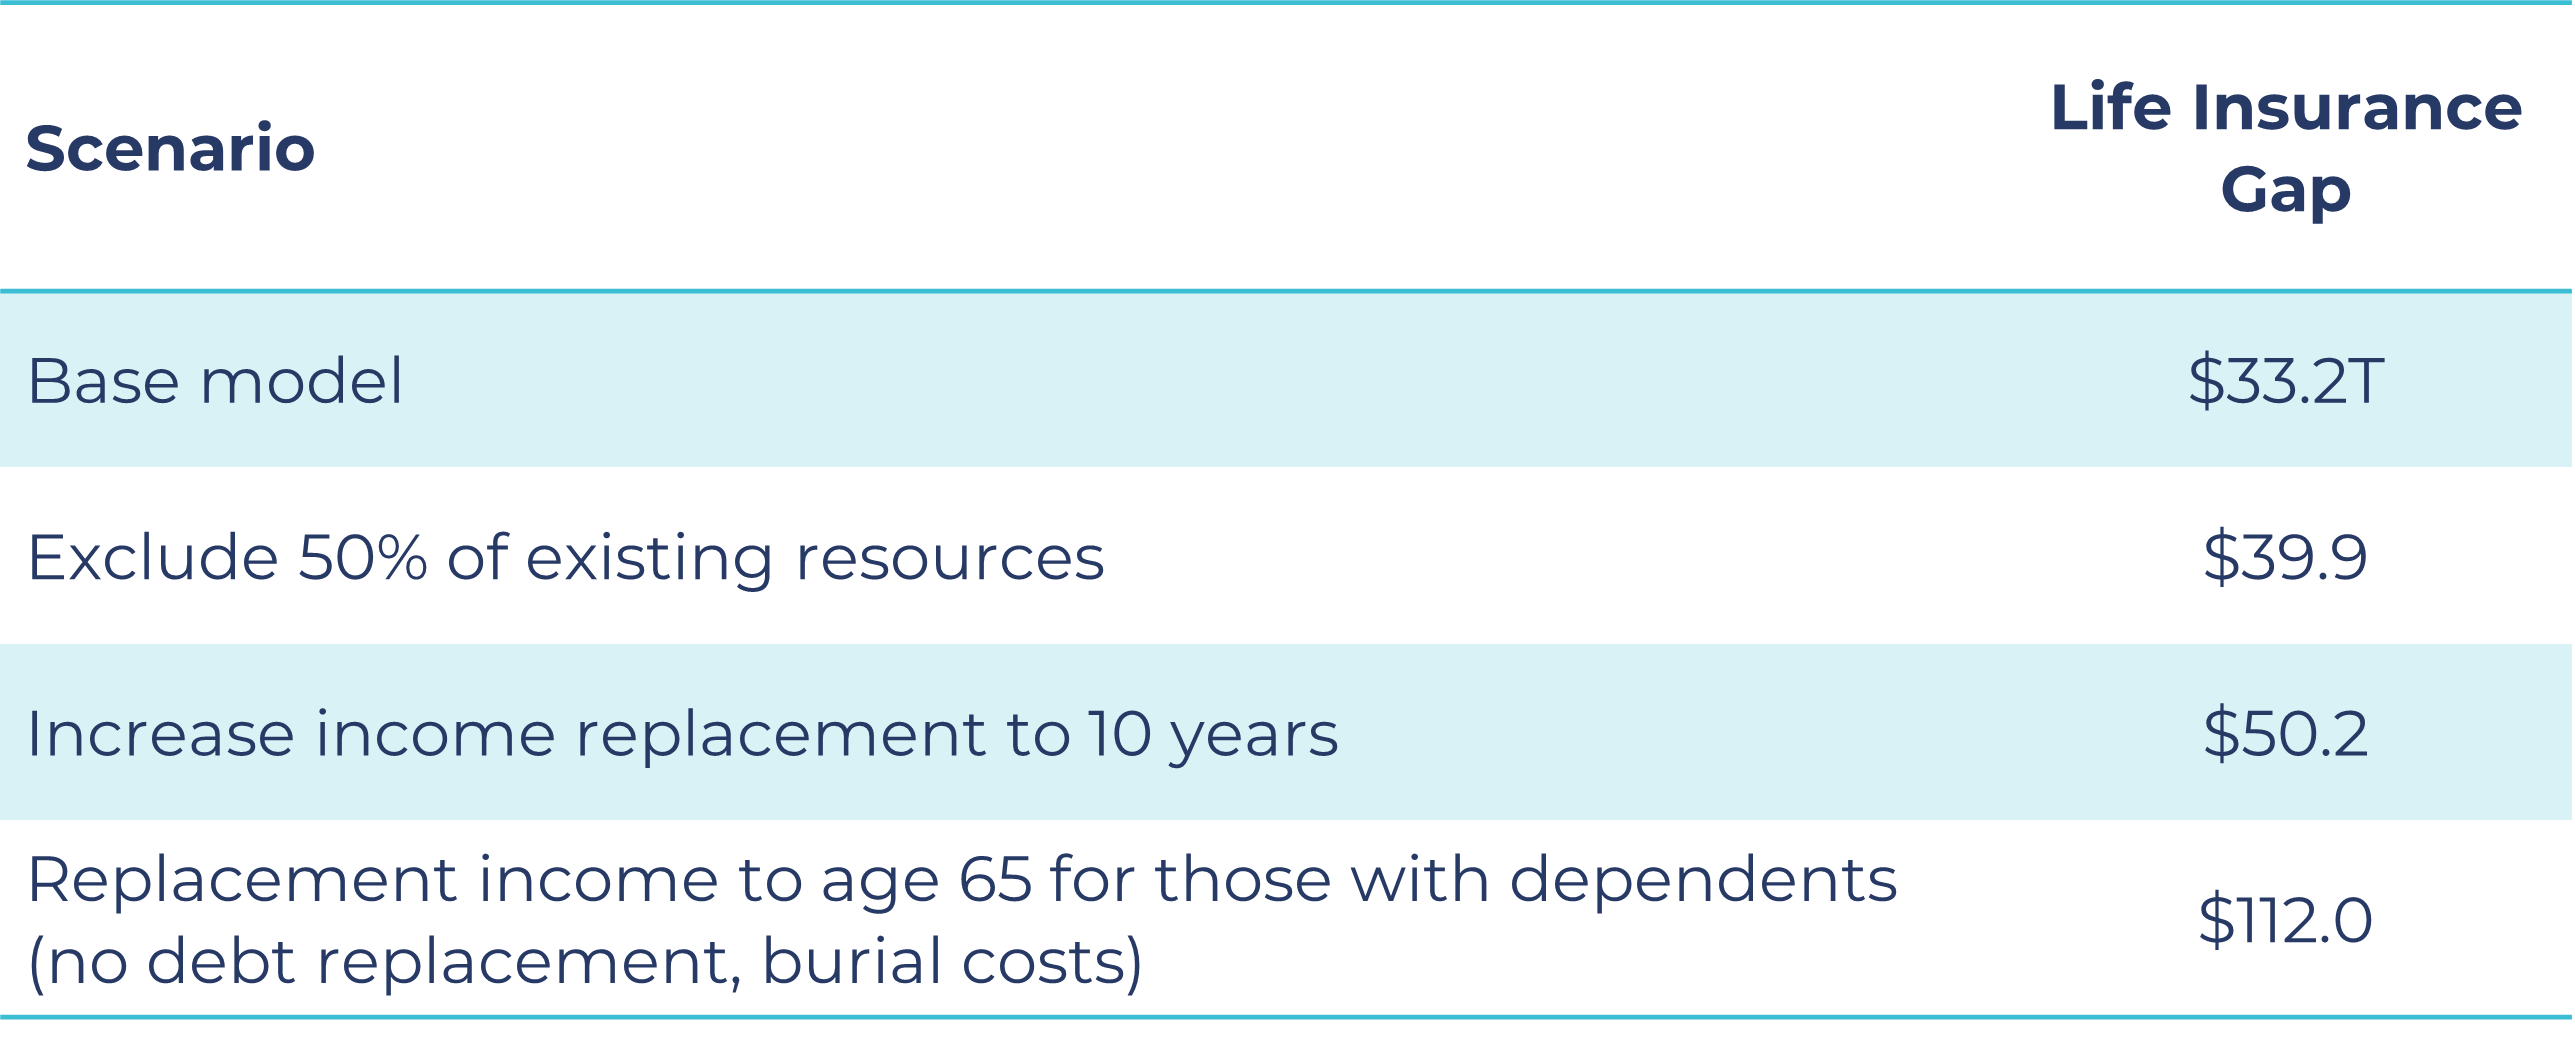
Greenwald Research developed a model to estimate the size of the gap in the U.S. The model follows a “typical” life insurance needs calculator. While the model assumptions can be adjusted in a variety of ways, the base model assumes 7 years of replacement income (not to exceed age 65) for anyone with dependents, full debt repayment, and $15,000 for burial/final expenses. The model then subtracts any existing financial assets and life insurance coverage to come up with a need.
The model suggests that 83.5 million U.S. households (representing 64% of all households) collectively have a gap of $33.2 trillion in life insurance coverage. This is the most conservative version of the model. A valid case can be made for any of the model scenarios below. In fact, replacing income to age 65 is one way to define human life value.
Sticking with the base model, let’s explore where some of the biggest opportunities lie.
Where are the largest gaps?
- Those with at least some life insurance have a larger gap ($19.2T) than uninsured ($14.0T)
- Mid-late career households ages 30-59 have a gap of $28.2T
- Similarly, Millennials ($14T) and Gen Xers ($14.7T) have the largest gaps
- Those who are married/partnered make up nearly the entire gap ($29.4T)
- Households with children make up the majority of the gap ($22.0T)
- The income replacement component results in households with higher incomes ($150K+) representing half of the gap ($16.4T)
- White households represent $23.0T of the gap
- Those with access to a financial professional ($18.7T)
These numbers are driven by higher average individual gaps than the sheer numbers of them. In fact, they look a lot like the people most companies are reaching or at least targeting today.
Selling life insurance to more of the same kinds of people will certainly help reduce the gap from a dollar perspective. However, it would have a much smaller impact on reducing the percent of households who need life insurance and, whose dependents arguably have less of an existing safety net if one of the household’s breadwinners were to pass away prematurely.
Which groups are most likely to have a gap?
- Those with no life insurance at all (77% have a gap)
- Those under age 40 (82%)
- Millennials and Gen Z (82% of each have a gap)
- Married/partnered households (67%, which is close to the overall 64%)
- Households with children (78%)
- Lower income households earning less than $50K (74%)
- Non-white households. Hispanic (85%) and Black/African American households (74%) are most likely to have a gap.
- Those without access to a financial professional (76%)
Some of these overlap with the gap size, especially when they have characteristics that imply a life insurance need, such as age, marital status, having children. These factors are combined in the chart below. There are millions of households needing life insurance throughout the entire lifecycle, which suggests there are opportunities for a wide range of products and uses.
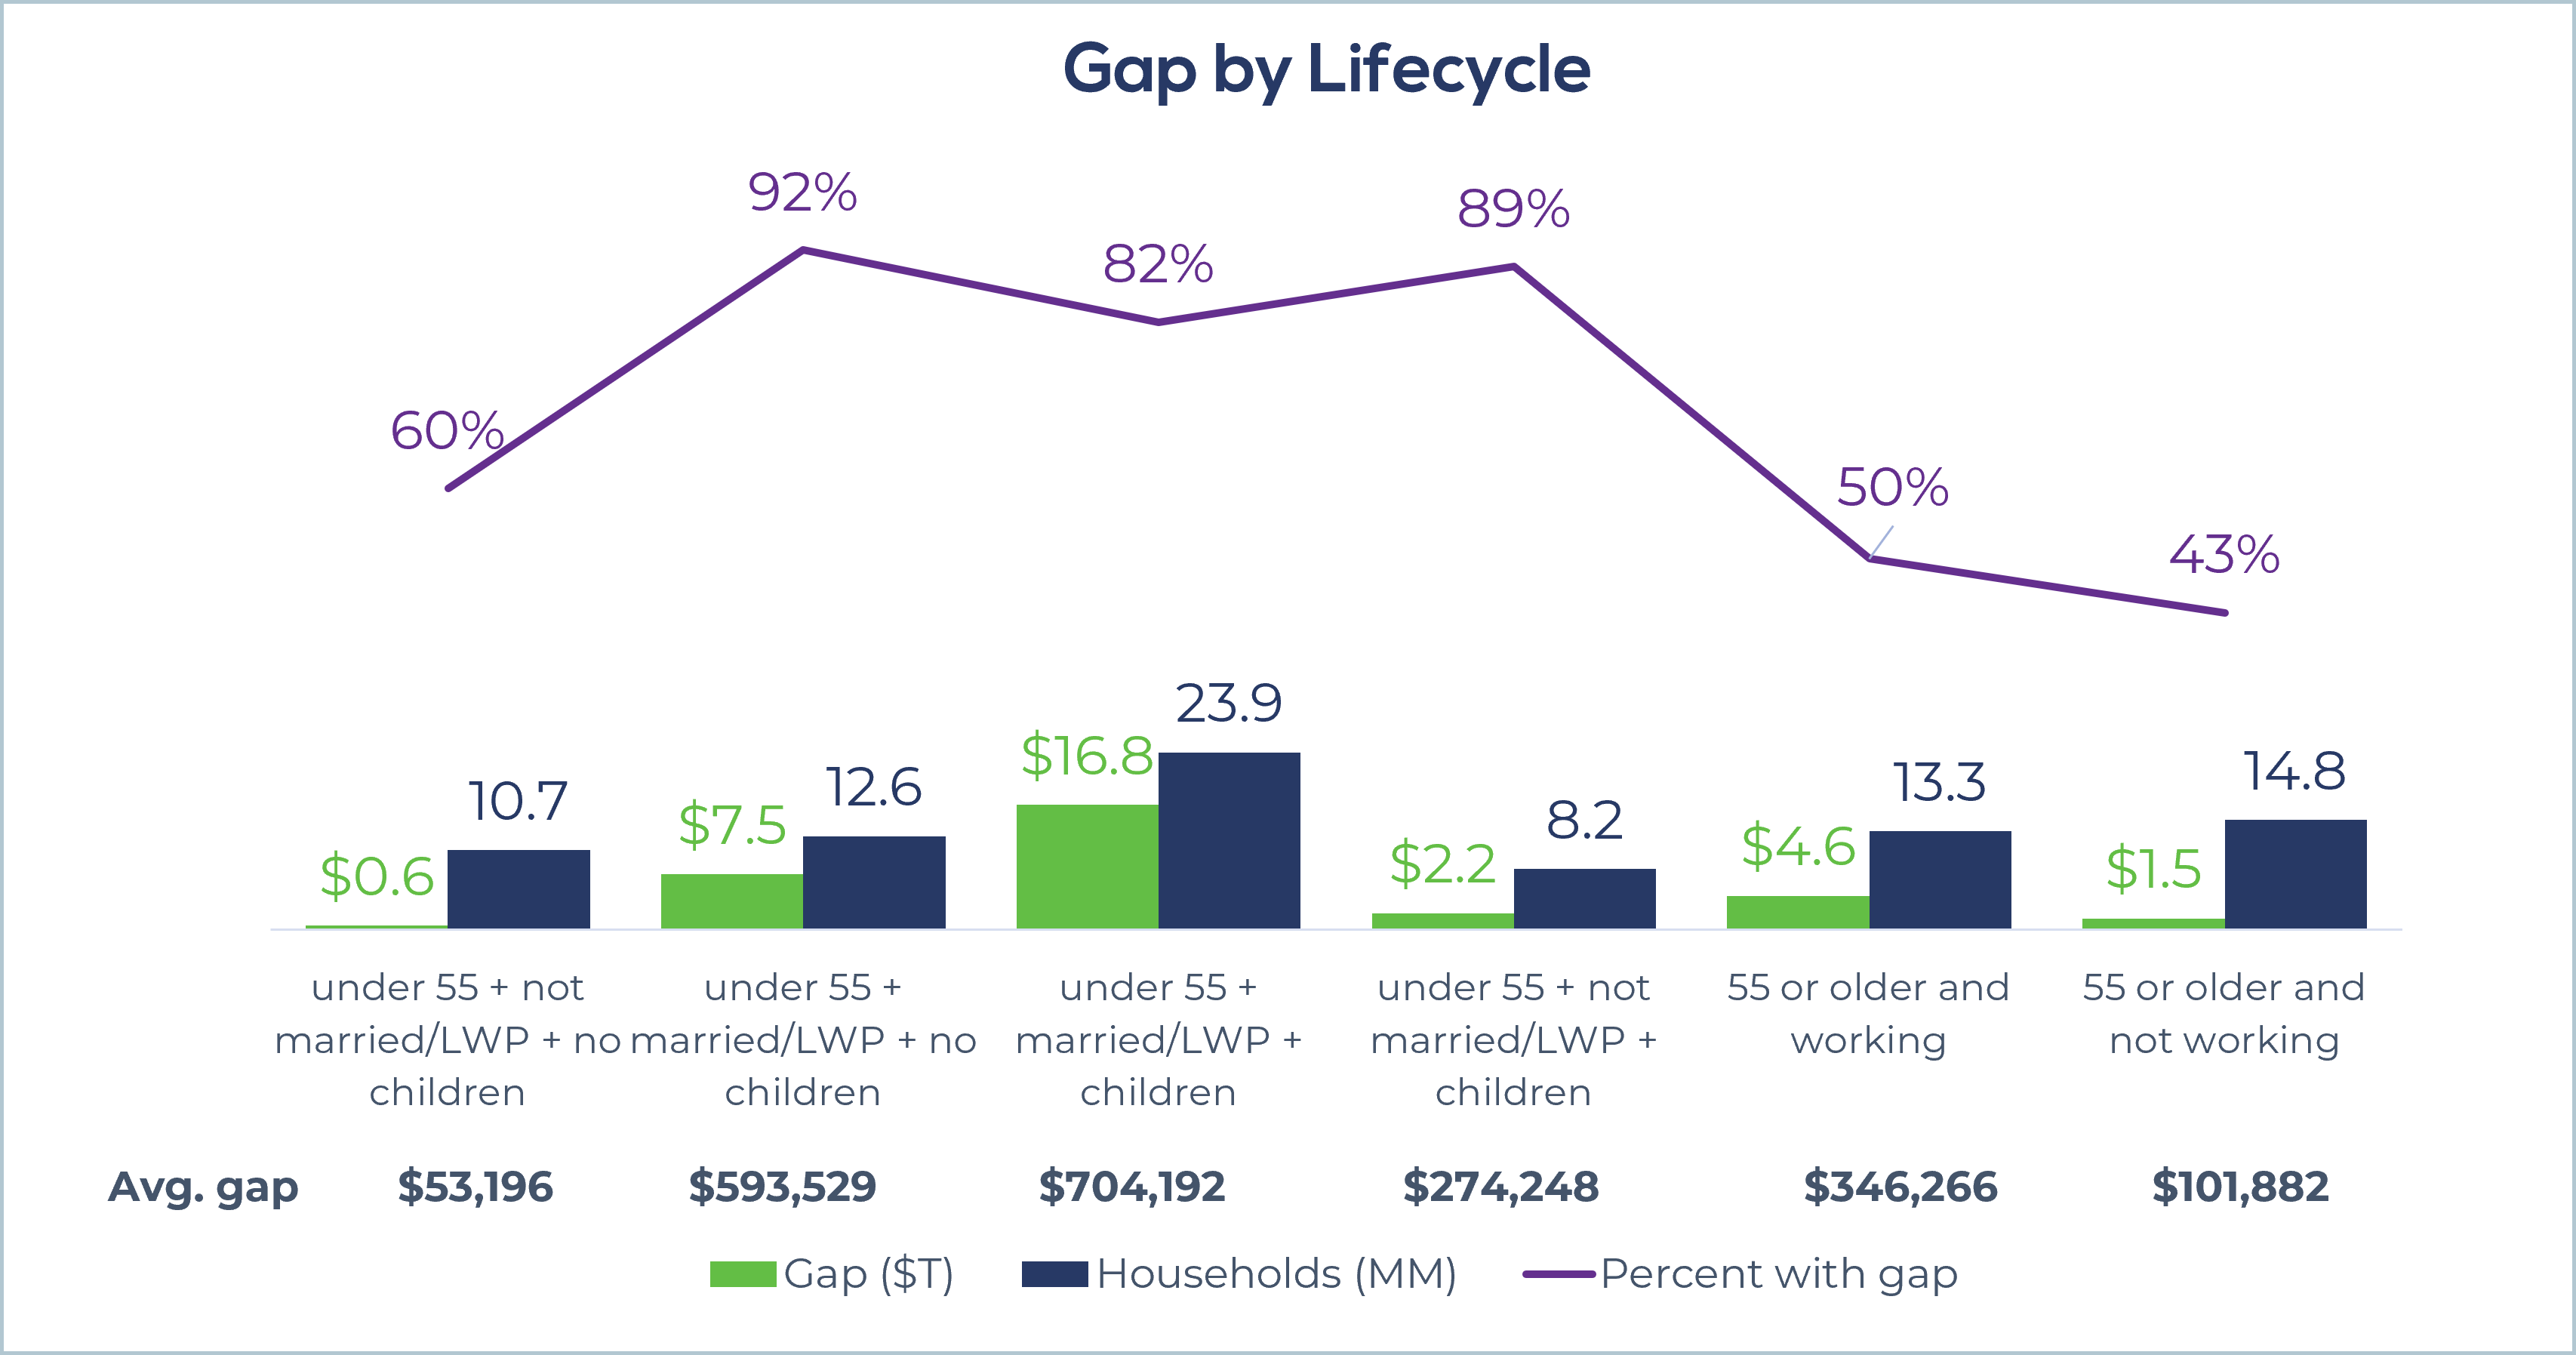
Making meaningful progress in closing the life insurance gap will require efforts in each of these areas, especially among those not explicitly shown on this chart. These include finding ways to engage with minority households, lower-income households, and those who don’t have ready access to an advisor. Where will your company define its niche?


