
We Need New Investment Portfolios and New Metrics to Adjust to the Low Interest Rate Environment
The low interest rate environment has created problems for those accumulating for retirement and in retirement. A significant allocation to fixed investments, which many use for stability, now contributes very little to return, driving down the potential for growth for the overall portfolio while also providing a less effective buffer against equity market loss.
Fortunately, there are solutions that have the potential for growth while protecting against a market drop, but these solutions add to the complexity of investment allocation decisions, and our current tools to measure risk tolerance don’t map to these new choices. In general, investment decisions require a more effective metric to help pre-retirees and retirees make better investment allocation decisions.
In this blog post, I will address the problem and the solution and provide a suggestion for the new metric.
The Problem
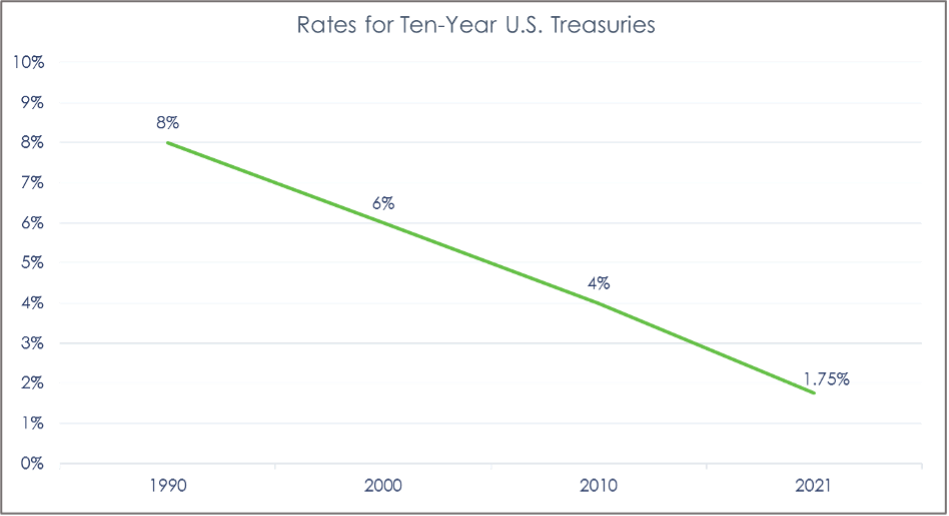
The extent to which interest rates have fallen has often not been fully appreciated. The interest rates paid on U.S. 10-Year Treasuries show the extent of the change. In 1990, they paid about 8 percent interest a year. That made investing for retirement pretty easy. By 2010, they had been cut in half, but 4 percent interest on the portfolio’s fixed part is still workable. Now, they’re about 1.7 percent, which is less than half of the long-term average. That’s unworkable.
But low rates on 10-Year Treasuries and relatedly low interest rates on corporate bonds, CDs, and other fixed investments don’t mean the need that bonds typically fulfill has gone away. People continue to need some protection against market risk, which has only been intensified by the COVID-19 experience. Concern about market volatility, according to our research, has gone up since the pandemic began.
Putting a significant portion of investable assets into bonds at this point has serious consequences. Gregory Mankiw, a leading economist who is the Robert M. Beren Professor of Economics at Harvard University (and was the Chair of the Council of Economic Advisors under George W. Bush) recently wrote, “Some of the implications of low interest rates are already clear. For example, a balanced portfolio of half stocks and half bonds has historically earned a return of 8.2 percent, or about 5 percent after inflation. My guess is that a more plausible projection is an inflation-adjusted return of about 3 percent.”1
Of course, if people earn less on their investments, they will need to save more in order to hit standard accumulation targets by the time of retirement. But the problem of low interest rates goes beyond that: it means that levels of accumulation for retirement that previous generations sought are no longer good enough. Mankiw went on to write:
“According to my calculations, to support any given level of for a 20-year retirement, a person’s nest entering retirement needs to be 19 percent larger.”2
Thus, maintaining a significant allocation to fixed investments, which is the standard way of protecting against volatility, will require most to save a lot more or work a lot longer, and often both, to have a financially secure retirement.
The Solution
Fortuitously, there is an alternative. Recently, there’s been innovation in the area of downside protection, especially with the introduction of many registered index-linked annuities and buffered ETFs, which offer protection against market downturns at the cost of limiting gain, while still providing an opportunity for a significant increase in value. These solutions join structured notes in providing investors with a full range of choices to reduce their reliance on bonds to protect their portfolio against excessive and unaffordable market risk.
The Need for a New Metric
The value of integrating downside protection into pre-retirees’ and retirees’ portfolios does create more complexity for the investor. Typically, investors and their advisors think in terms of allocations between stocks and bonds. Thus, many thought in terms of being 60/40 or 50/50 investors, referring to their division of investments between stocks and bonds. Indeed, my financial advisor just described his views on the investment climate by succinctly stating he is “now recommending 60/40 allocations.”
This problem of needing to protect against excessive investment risk, but not being able to use bonds as extensively as in the past, is calling on investors to change their strategy and allocate three types of solutions: stocks, bonds, and downside protection products. Not only that, but there are choices in the degree of downside protection that must be made. To offer just one example of many, an investor can buffer 10 percent of loss, 20 percent of loss or 30 percent of loss or put a floor of 10 percent of loss and/or make various other choices. Advisors must help their clients decide how much risk protection they should seek and how to pursue it. We need a new metric to help investors make these complex decisions.
A Proposal for the New Metric
Unfortunately, as we consider new ways of helping investors make decisions on investment risk, we start on a weak foundation. There is evidence that investment risk tolerance questionnaires aren’t effective at accomplishing their objective of guiding asset allocation decisions and many investors aren’t well informed, even after working with their advisors, about how to decide how much investment risk they should take. For example, identifying someone as a “conservative investor” does not provide much guidance on how to make complex investment choice decisions.
There is clear evidence that visuals are helpful in guiding investment decisions. Further, investors strongly value being provided with two to three alternatives, as a list that is too extensive can lead to indecision. We suggest showing how two portfolios would perform in:
- A very bad market that has only occurred 5 percent of the time in the last 60 years
- A bad market that has only occurred 20 percent of the time in that period
- A correspondingly very good market that has only occurred 5 percent of the time in the last 60 years
- A correspondingly good market that has only occurred 20 percent of the time in that time period
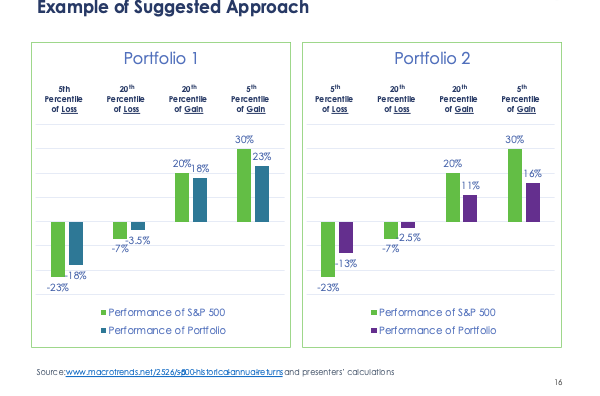
To represent historical market performance, we recommend presenting the 5th percentile, 20th percentile, 80th percentile, and 95th percentile performance over one year of the S & P 500 since 1960, with the 5th percentile representing the level of annual loss only reached 5 percent of the time and the 95th percentile representing the level of annual gain only reached 5 percent of the time.
This visual presents an actionable, understandable metric for evaluating the riskiness of investments that gives an investor important information that can better contribute to a decision. The chart below shows, using this method, how two portfolios might compare. By showing, in this case, that one portfolio would have lost a bit more in down markets, but the other portfolio would have earned considerably more in just as likely good markets an investor can better choose between the two.
This approach has the following advantages:
- It’s holistic. By showing the likely returns of both a very good and very bad market, the investor can judge the potential “risk/reward” outcome. Many discussions of risk focus only on the downside risk and often lead to overly conservative portfolios.
- It provides information on level of risk. It is useful for investors to know that the market rises on average and that gains tend to be higher than losses.
- It allows for better comparisons of alternatives.
- It is more interactive and more likely to stimulate discussion.
- It’s an effective communications tool. It gives investors a better understanding of how investment risk is reflected in the portfolio.
The Implications of the Low Interest Rate Environment
The low interest rate environment has created a solvable problem for investors. With bonds unable to perform their traditional role of providing a high degree of safety with an acceptable level of return, both pre-retirees and retirees will have to make a new set of decisions to get the potential for gain they need, with the level of protection against loss they require. Adding downside protection to the mix as a new approach to measuring risk tolerance that is mapped specifically to different solutions will help pre-retirees deal with this environment and effectively meet their needs.
If you’re interested in discussing this new metric or want to hear more of our thoughts, contact us.
1. Gregory Mankiw, “The Double-Edged Sword of Low Interest Rates,” New York Times, December 5, 2020 Business Section
2 Ibid.


