Optimizing Thought Leadership Programs

By: Mathew Greenwald
10/1/2024

Thought leadership research studies are widely used by asset managers, distribution companies, and insurance companies. The belief in the value of these studies is strong. My firm recently conducted a survey of executives in retirement companies and asked them about expected use of eight marketing tools. Seven in ten said they expected their use of thought leadership research to grow over the next three years, more than for any other marketing tool or process.

Despite this widespread use, it is my firm’s observation that thought leadership programs often do not achieve their potential benefit. To be most effective, thought leadership initiatives should achieve three basic objectives:

  1. Impact an audience that is important to the company.
  2. Study a topic that is both important and challenging to the target audience. The study should be on a topic that the target market wants to address more effectively.
  3. Provide information and insights that help the audience achieve their objectives.

There is one obvious reason for the need to provide information that helps the target audience meet its objectives: financial professionals, consumers, and other possible targets of thought leadership want to do better on key endeavors and will value those who provide information and insights that help them do that. The days of providing information that is simply “nice-to-know” are long gone.

Unfortunately, I have seen thought leadership efforts that do not appear to have been designed to meet these objectives, but designed only to produce information that is interesting or get press attention. My main concern is that studies conducted for this purpose do not provide the value that can be achieved by the same level of expenditure as a more effectively designed and executed study.

To get the highest potential impact, three key steps are needed.

  1. Impact an audience that is important to the company.

First, it is important to identify a target audience for the thought leadership effort that will provide maximum value to the company. Sometimes the target can be very narrow, such as a particular distribution channel that a company wants to penetrate: Pure RIAs, for example. Sometimes the target can be broader, such as financial professionals from all channels who have clients in the company’s target market: for example, financial professionals with clients who are retired. It is important that the target for the thought leadership effort not be too broad, however. The target can be a segment of consumers, but thought leadership programs aimed at all consumers tend to be too broad and generalized in the value they provide.

A segment of financial professionals is often the target of a thought leadership program because that is where the benefit to the financial services company is most direct. Information from an effective thought leadership program can help wholesalers and others get access to financial professionals and give them a value add that will enhance the relationship between the financial professional and the wholesaler or the company.  It can help company representatives get invitations to make presentations to a financial professional’s clients. It can enhance the image of a company. It can motivate a financial professional to share publications of research findings with their clients thereby producing value for the financial professional and end consumer.

  1. Study a topic that is both important and challenging to the target audience.

The second step, as stated, is to choose a subject that goes beyond being simply interesting. It should be on a complex issue the target audience is, to at least a certain extent, struggling with. Examples include how financial professionals can best formulate relationships with their clients’ adult children, how they should establish asset level goals for retirees, or how consumers should formulate goals for their retirement years.

  1. Provide information and insights that help the audience achieve their objectives.

The third step is, in our opinion, the most differentiating. There are many studies, maybe most particularly in the retirement area, that provide information which is interesting but simply do not provide new insights that help the target audience better meet their objectives. One example is the many studies that indicate that many are not saving enough for retirement. These studies are often interesting, but they would be a lot more effective if they helped financial advisors better motivate or guide their clients or helped develop new tools to help individuals better assess how much they should save to meet, or set, lifestyle goals in retirement.

Understanding Your Target Audience for Thought Leadership

A good thought leadership study will go beyond producing interesting information: it will help the target audience better meet their goals. Financial professionals, pre-retirees, and retirees, for example, face a number of challenges. A good thought leadership study will help them address one of those challenges.

Designing research that produces this benefit requires a deep understanding of:

  • the issue being confronted, such as retirement planning
  • how the issue is now being addressed and areas in which improvements should be made
  • the target audience’s satisfaction with current approaches and their interest in new ideas

With these understandings, thought leadership programs can be constructed that provide very significant value.

Life’s Persistent Questions #6: How Big is the Life Insurance Coverage Gap?

By: Eric Sondergeld
9/23/24

The name Life Insurance Awareness Month (LIAM) implies that some may be unaware of the benefits of life insurance and why or whether they may actually need it (or need more of it). There is certainly plenty of evidence that many Americans are un- or under-insured. This begs many questions. How many people are we talking about? How much do they need? Who needs it the most?

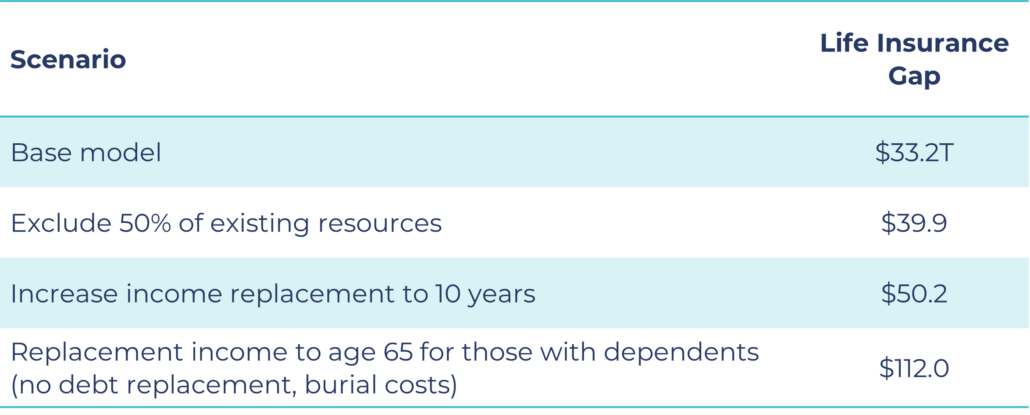
Greenwald Research developed a model to estimate the size of the gap in the U.S. The model follows a “typical” life insurance needs calculator. While the model assumptions can be adjusted in a variety of ways, the base model assumes 7 years of replacement income (not to exceed age 65) for anyone with dependents, full debt repayment, and $15,000 for burial/final expenses. The model then subtracts any existing financial assets and life insurance coverage to come up with a need.

The model suggests that 83.5 million U.S. households (representing 64% of all households) collectively have a gap of $33.2 trillion in life insurance coverage. This is the most conservative version of the model. A valid case can be made for any of the model scenarios below. In fact, replacing income to age 65 is one way to define human life value.

Sticking with the base model, let’s explore where some of the biggest opportunities lie.

Where are the largest gaps?

  • Those with at least some life insurance have a larger gap ($19.2T) than uninsured ($14.0T)
  • Mid-late career households ages 30-59 have a gap of $28.2T
  • Similarly, Millennials ($14T) and Gen Xers ($14.7T) have the largest gaps
  • Those who are married/partnered make up nearly the entire gap ($29.4T)
  • Households with children make up the majority of the gap ($22.0T)
  • The income replacement component results in households with higher incomes ($150K+) representing half of the gap ($16.4T)
  • White households represent $23.0T of the gap
  • Those with access to a financial professional ($18.7T)

These numbers are driven by higher average individual gaps than the sheer numbers of them. In fact, they look a lot like the people most companies are reaching or at least targeting today.

Selling life insurance to more of the same kinds of people will certainly help reduce the gap from a dollar perspective. However, it would have a much smaller impact on reducing the percent of households who need life insurance and, whose dependents arguably have less of an existing safety net if one of the household’s breadwinners were to pass away prematurely.

Which groups are most likely to have a gap?

  • Those with no life insurance at all (77% have a gap)
  • Those under age 40 (82%)
  • Millennials and Gen Z (82% of each have a gap)
  • Married/partnered households (67%, which is close to the overall 64%)
  • Households with children (78%)
  • Lower income households earning less than $50K (74%)
  • Non-white households. Hispanic (85%) and Black/African American households (74%) are most likely to have a gap.
  • Those without access to a financial professional (76%)

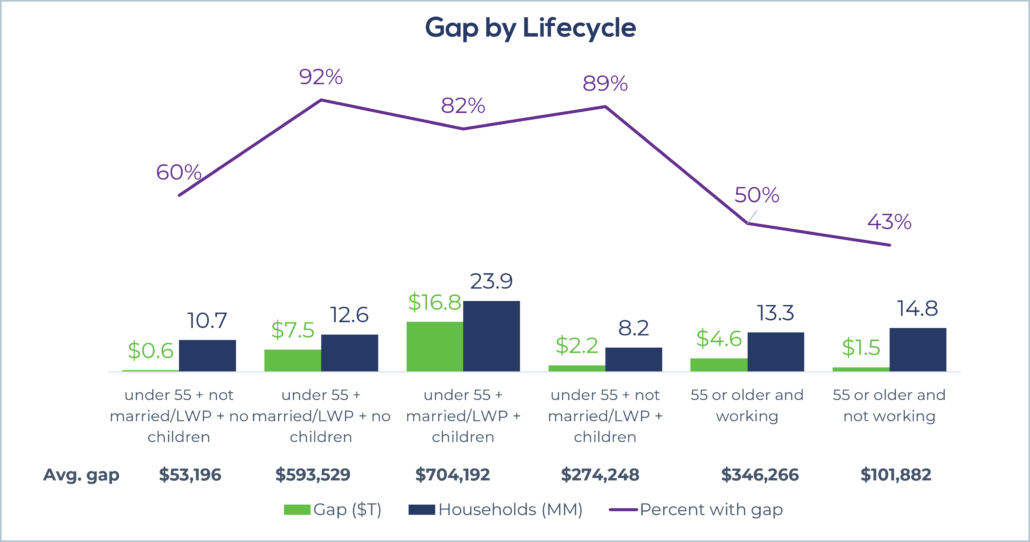
Some of these overlap with the gap size, especially when they have characteristics that imply a life insurance need, such as age, marital status, having children. These factors are combined in the chart below. There are millions of households needing life insurance throughout the entire lifecycle, which suggests there are opportunities for a wide range of products and uses.

Making meaningful progress in closing the life insurance gap will require efforts in each of these areas, especially among those not explicitly shown on this chart. These include finding ways to engage with minority households, lower-income households, and those who don’t have ready access to an advisor. Where will your company define its niche?

Life’s Persistent Questions #5: Can We Make Life Insurance the Income Replacement Solution It’s Meant to Be?

By: Eric Sondergeld
9/10/2024

Check out almost any life insurance needs calculator and it is obvious that the largest component of the answer is an amount representing some multiple of income. Amounts are also typically included for immediate payoff of outstanding debt, college education, final expenses, and even items such as childcare and an emergency fund.

Other than digitizing these formulas in the form of online calculators, the theory behind them has remained largely unchanged for decades. Before that, we likely used rules of thumb of income multiples, many of which are commonly used in practice today. I see two main problems with this approach to estimating life insurance needs. First, the amount becomes quickly outdated. As time passes, fewer years of income replacement are needed, children may no longer be dependents, incomes have grown, debt gets paid down, or a larger home is purchased with a bigger mortgage, etc.  Second, if income replacement is indeed the largest component of the life insurance benefit, then why is the benefit not paid as an income?

There’s a way to address both of these issues. The first requires an admission that there’s a fair amount of double-counting going on in the current approach. If life insurance provides replacement income (whether paid in a lump sum or over time), that income presumably is currently being used to pay down debt, save for children’s college, etc. I can’t believe nobody has stopped to ask, “why do I need to replace my income AND some of the things it pays for?” or “Why is 10 years of income replacement the norm?” The second is to change the terminology from “death benefit” to “income amount.” If life insurance is to truly be an income replacement product, we need to present it and talk about it that way. For products intended to primarily replace income, we might eliminate the term “face amount” from our vocabulary. Instead, the conversation should be about how much income is needed and for how long.

The how much starts with your annual income and subtracting an amount for taxes (since the death benefit is not taxable) and perhaps a bit more since the income won’t need to support the insured after he or she has passed. In addition, an assumption for income growth can be incorporated. The length of time could be a number of years or, preferably, to a specific age. For example, a 40-year-old whose youngest child is 10 might expect to support that child until they reach age 22 and are out of college. That parent might buy coverage that replaces their income until they are 52. Another example is to replace income until an expected retirement age if there are one or more members of the household (or household expenses such as mortgage payments) reliant on that income. The life insurance benefit would be expressed as a monthly amount, just like with disability income insurance.

In fact, all the above ways of defining the benefit already exist within the disability income market. And like disability income insurance, the concept of face amount is a foreign one. The only remnant of one in this approach might be allowing for a modest lump sum benefit to cover final expenses. An added benefit is that the life insurance conversation dovetails nicely with the disability income insurance conversation. Creative companies could even develop a combination product that replaces income until retirement age, potentially at different amounts depending on whether the insured is disabled or dead.

Presenting life insurance as an income replacement solution offers the following additional benefits:

  • The death benefit and its intent become clearer to beneficiaries, as it’s simply a continuation of the income that has supported them all along.
  • Beneficiaries don’t have to figure out how to manage a lump sum payment, something people are generally not great at doing.
  • It simplifies the conversation and removes complicated factors like amounts for debt and education and having to decide whether the income replacement (that is paid as a lump sum) should last (or more accurately, represent) seven, ten, or twenty years.

Making life insurance the true income replacement vehicle its meant to be requires a shift in thinking, benefit calculation, and terminology. Its positives are clear and can make purchasing life insurance easier for customers.

Are Workers Better Off At Home?

By: Sara Rubinstein 2/27/2024

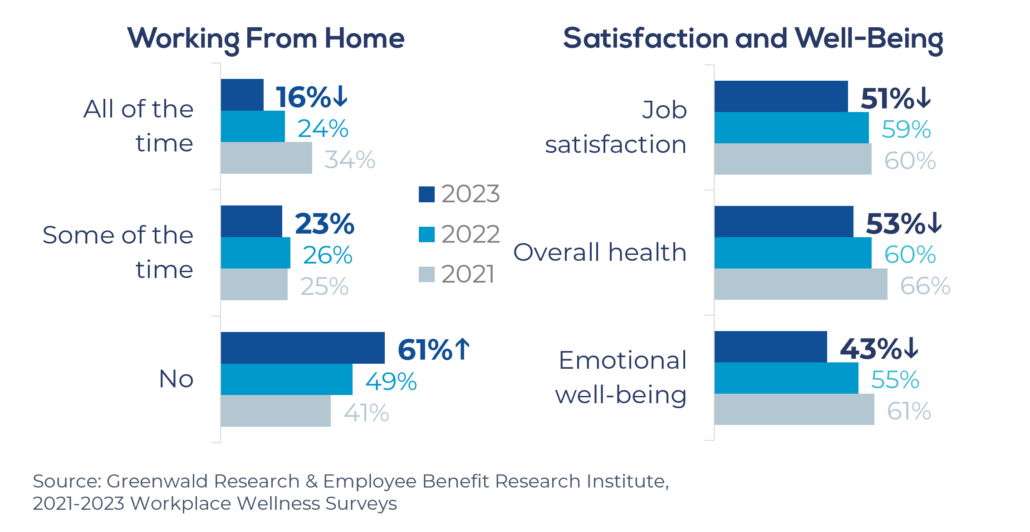
The number of U.S. workers returning to the office is increasing. The results from the 2023 EBRI/Greenwald Workplace Wellness Survey show that six in ten workers never work from home, up from 49% in 2022 and 41% in 2021.

But as workers return to the office, a troubling trend is emerging: Down from six in ten last year, only half of all workers report being extremely or very satisfied with their job overall. Overall health and emotional well-being are also down. Is an increased return to the office having a negative impact on workers?

In-Person vs. Remote Work Trends

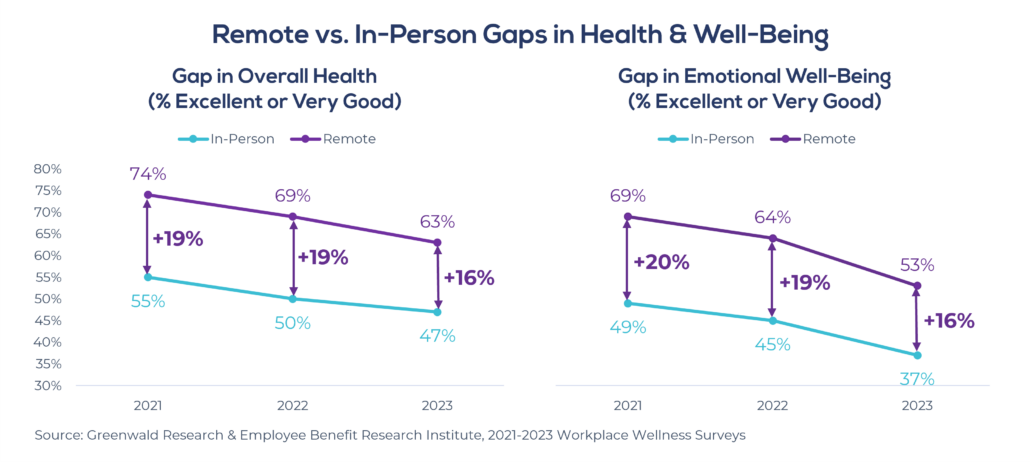
When it comes to work-life balance, in-person workers feel worse: only 30% describe it as excellent or very good compared to 45% of remote workers. In-person workers also rate their overall health and well-being worse than remote workers. However, in-person and remote workers do not greatly differ in job satisfaction, with roughly half feeling extremely or very satisfied overall, and nine in ten being likely to stay with their current employer for the next two years.

In general, those who give a low rating regarding their overall health and emotional well-being are less likely to be satisfied with their job. So, if there is a difference in well-being between in-person and remote workers, why isn’t there a difference in job satisfaction? What else could be causing 2023’s decrease in overall job satisfaction?

Perhaps it has to do with when workers returned to an in-person setting. Workers who returned to in-person in 2023 are less likely to rate their well-being highly than those who went back to the office earlier. One hypothesis is that there is a brief reacclimating period that former remote workers must endure before their well-being returns to baseline levels. While this is an intriguing theory, there is still no difference in overall job satisfaction (49% vs. 51% in 2022 and 2021).

We also see that the gap in overall health and emotional well-being between in-person workers and remote workers is closing slightly, suggesting that something other than a return-to-office is responsible for lower health, well-being, and job satisfaction scores in 2023.

If 2023’s job satisfaction decrease is not driven by more employees returning to the office, the question why in-person workers rate job satisfaction on par with remote workers but rate well-being metrics lower still persists. Perhaps the nature of the work being done plays a role. Are workers in industries with fewer remote work opportunities less well?

The Impact of Industry

When the pandemic hit, not every worker could stay at home. Many industries required workers to stay in-person or return earlier than others, including healthcare, education, retail, food, hospitality, manufacturing, construction, transportation, and agriculture. How do these workers feel?

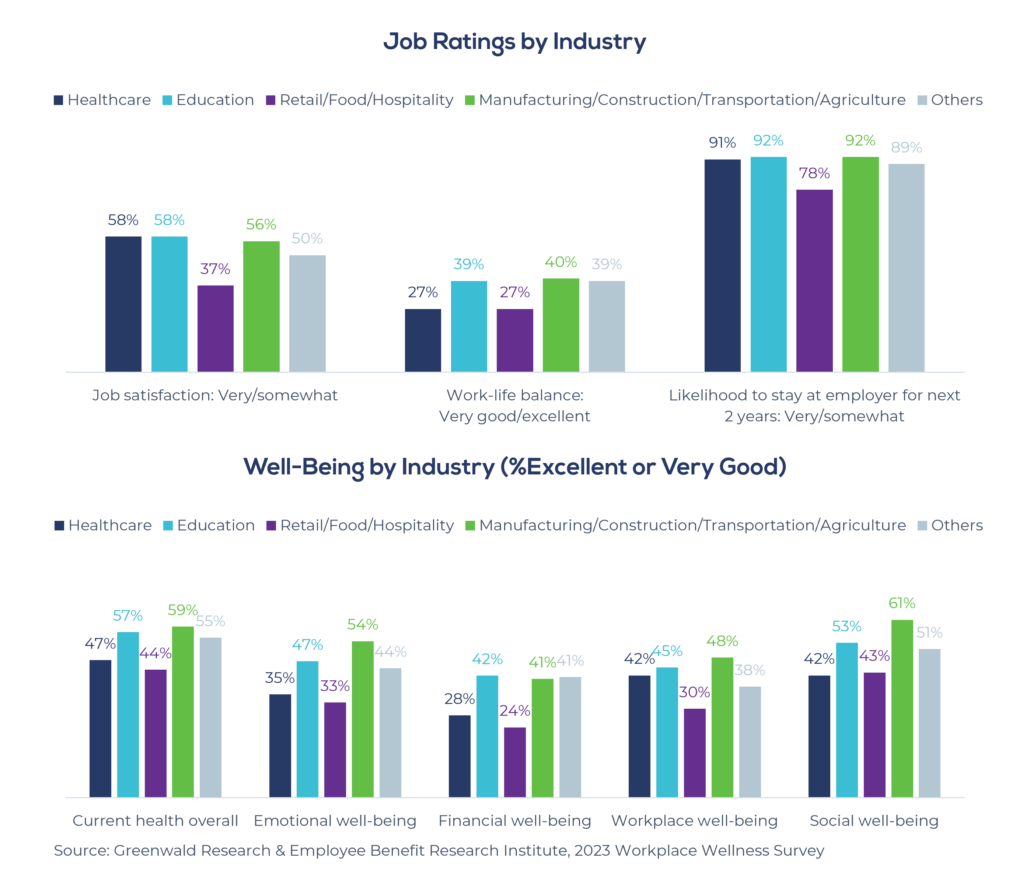
Compared to all others, these industries report worse work-life balance and are less likely to say their financial well-being is excellent or very good. Those in retail, food, and hospitality stand out even among other primarily in-person industries. They are least likely to stay with their employer, report worse work-life balance, are least satisfied with their job overall, and are least likely to say their well-being is excellent or very good. Similarly, healthcare workers also have relatively poor work-life balance and poor emotional and financial well-being. However, healthcare workers are more satisfied with their job overall.

So what does this mean overall? We know that job satisfaction and the well-being of workers is down. In-person workers report worse well-being and more people are returning to an in-person work setting. But their job satisfaction remains unaffected. What else could be causing this decrease? Is there something else happening to these workers that needs exploring? Or is it too soon to see the effects of this shift in work setting? It will be interesting to watch how remote work continues to impact workers’ well-being and job satisfaction overall.

To learn more about worker well-being, please view the 2023 Workplace Wellness Report released by Greenwald Research and the Employee Benefit Research Institute (EBRI) or watch Greenwald Research’s coffee break on workplace wellness.

Life’s Persistent Questions #4: How Much Life Insurance Do I Need?

By: Eric Sondergeld
11/27/2023

So far in this series, I’ve covered the questions about when someone needs life insurance[1] what type they should buy,[2] and what makes life insurance special[3]. For us industry insiders, these may seem like simple questions. However, as I’ve demonstrated, identifying whether and when you need life insurance isn’t always obvious, and thus, the need may instead sneak up on most consumers. The question of “what type” can lead to more questions to which consumers may not readily know the answers. One of those questions is just how much life insurance to buy.

The question of “how much” is relatively unique to life insurance.         

Assuming someone has determined they might need life insurance (and even which type to buy), they must figure out how big a policy to purchase. This is something they don’t necessarily need to do when buying other types of insurance. Different health insurance policies share costs with the insured in different ways and may come with different maximums, deductibles, etc. With auto insurance coverage, the consumer can select from a limited set of options for bodily injury liability, property damage, etc. Home insurance coverage amounts are predicated on the value of the home. Disability income and long-term care insurance offer different coverage amounts, though the range of coverage amounts is much more limited than with life insurance.

How much do we need? There is no right answer.

When it comes to life insurance, there are seemingly countless needs calculators, rules of thumb, and other techniques for figuring out how much life insurance to buy. Different needs calculators provide a wide range of recommended amounts for a particular individual. Most ask questions that the consumer may not be able to easily answer, such as how many years of income replacement they want or need. Behind this question is an implicit assumption that life insurance is intended to help the policyholder’s loved ones recover financially following their death, but only for a time, after which they’ll need to support themselves. This is never explained to would-be buyers, nor do buyers explain to their beneficiaries why they bought life insurance and what the death benefit is intended to accomplish.

Payout options don’t align with the idea of life insurance as income replacement.

The fact that income replacement often contributes the most to the “how much” question suggests that life insurance is an income replacement product. Why then do policies pay a lump sum upon death? If beneficiaries were to read the policy, they would find that in most cases the ability to receive the benefit in installments exists. Yet at claim time, such options are seldom presented.

Coverage amounts diverge from needs as they change over time.

What’s more is that once a policy is purchased, the underlying “need” can change significantly over time. With most coverage having a level face amount, coverage amounts and underlying needs can diverge over time. There is usually no mechanism for proactively adjusting coverage to account for changes in these assumptions.

Life insurance is for the beneficiary.

In my previous blog on what makes life insurance so special, I reminded readers that life insurance is the only insurance where the insured is not the beneficiary. I argue that the two main benefits of life insurance are the peace of mind it brings to the insured and the financial benefit to dependents. If someone other than the insured is going to benefit from the policy, then shouldn’t we give more consideration to them in designing products, determining coverage amounts (over time), etc.?

It’s time to innovate around “how much” life insurance people need.

While there certainly have been many innovations in life insurance in recent years, such as life-LTC combination products, indexed universal life, etc., the basic structure of life insurance has remained relatively unchanged. The question of “how much” offers tremendous opportunities for innovation. This includes new ways to define how much (because there is no right answer), how benefits are paid, whether coverage amounts are set to change over time or could be changed as needed, designing for the ultimate user (e.g., the beneficiary), whether coverage is purchased all at once or over time, etc.


Please contact us if you’d like to test any of the above concepts or understand how consumers think about the “how much” question.


[1]Life’s Persistent Questions #1: When is the Best Time to Buy Life Insurance?

[2]Life’s Persistent Questions #2: What Type of Life Insurance Should I Buy?

[3]Life’s Persistent Questions #3: What Makes Life Insurance Special?

The Retirement Confidence of Caregivers

By: Marie Ammar and Sara Rubinstein
10/16/2023 Read more

Crafting a Successful Win-Loss Program to Enhance Sales

By: Greg Hershberger
9/18/2023
Read more

Life’s Persistent Questions #3: What Makes Life Insurance Special?

By: Eric Sondergeld
9/14/2023
Read more

It’s Time to Start a New Habit in Retirement Savings

by: Eric Sondergeld
7/19/2023
Read more